 DO-IT-YOUSELF

Report CE - SOFTWARE PRINTING DEVELOPMENT TOOLS FOR PPCs
SyntegraTech® has partnered with SYWARE® to bring you the full line of SYWARE® development, printing and communications tools for Pocket PCs, SmartPhones, and Mobile 6 Devices. SyntegraTech® can provide you with all of these powerful tools and all of the hardware and software you need to get started building your own system. You may purchase either these development tools by themselves, in combinations in various suites, as part of an off-the-shelf system, or as part of a DIY Package, that includes a device and the development tools required to make it instantly useful, or you purchase any device by itself. Please click to order.

Report
CE Personal Edition $79
Report CE Professional Edition $299
Full-featured reporting, printing, and graphing capabilities for Pocket PC and Windows CE devices Report CE® allows users to easily create and print custom documents from any Windows Mobile device, including Pocket PC and Windows CE handhelds and tablets. The mobile database reporting software can be used to create many types of documents, including: invoices, quotes, customer receipts, pictures, graphs, and bar code labels. Documents can be saved or emailed to others in Rich Text Format (RTF) or as text files. Report CE is a quick and easy way to enhance communication with customers, distributors, colleagues, family, and friends. Royalty-free distribution is available with Report CE Professional Edition, except when using SQL Server CE databases.
Report CE draws on data from any of the following: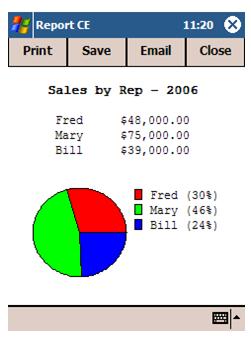
- Tables built with Visual CE.
- SQL Server CE databases (requires sqlceEnable).
- Wirelessly connected database servers, allowing you to print reports, such as inventory updates, from remote locations (requires mEnable).
- The Pocket Access (.cdb) database format
A single report can draw data from multiple tables within the same database. Report design and layout are done either on a desktop computer or a Pocket PC device. Reports can be displayed and printed in color, and can include pictures, graphs, headers and footers, data, and calculated values, providing a professional look and feel. Printing is done via the infrared port of the device, Bluetooth, serial port, network printer, or from the desktop.
Report CE enables you to add graphs to reports. You can choose from four graph styles: column, line, pie, and scatter, and information can be displayed in many different ways. Data points can be graphed from either a column series or a row series, as in Excel.
 More than 20 different numeric and alphanumeric bar code formats can
be printed, allowing users to combine the power of a mobile database
with the flexibility of a portable printer. For instance, you can log
and bar code new products right on the receiving dock or encode
compliance information in remotely located equipment.
More than 20 different numeric and alphanumeric bar code formats can
be printed, allowing users to combine the power of a mobile database
with the flexibility of a portable printer. For instance, you can log
and bar code new products right on the receiving dock or encode
compliance information in remotely located equipment.
Report CE's filtering capabilities allow users to choose only the records they wish to view. Columns can be sized for efficient professional presentation. Users can apply filters to control what data gets reported at report generation time. Filters can be based on constants or embedded Visual CE variables, allowing filter values to be specified dynamically as the report is run. Developers can apply command line switches when launching reports from applications built using .Net, eMbedded Visual Basic, or eMbedded C++, allowing users to bypass such features as “print preview” or jump directly into a report by skipping filter dialog boxes.
New in Report CE 5:- Graphing – Pie charts, Column charts, Line charts, and Scatter charts
- Groups – Allows for sub-totaling
- Distribution Wizard – Automates the creation of runtime installers
- Sections - Allows bands larger than a page and prevents one control from stretching over another
- Regional Settings – Adds support for foreign numbers and currency
- Hide Values if Zero - Report field is blank when the expression returns 0
- @pagecount - Returns the total number of pages in the report
- Seconds - Seconds in datetime are fully supported


![]() SYNTEGRATECH
SYNTEGRATECH
CONTACT: +1(603) 225-4008 or
syntegratech@syntegratech.com
Webmaster: D. Mark Read
Modified: 10/3/2011


